
My youth baseball scoresheets
I present my youth baseball scorecard. It is designed to give the youth baseball scorekeeper the ability to answer the most frequently asked questions without delay. It gives maximum space to write while keeping all the visual hints about the progress of the game. It incorporates pitch counting in a way that makes it easier for the scorekeeper to recover from lapses of attention.
A PDF version of this description is here:
And all the files put together into one file:
Youth_baseball_scoresheets_full_package
Layout
A youth game is typically six innings long, and most teams use a continuous batting order in which all players (12 or more) are in the lineup. So instead of the symmetric 9×9 grid, this scoresheet has space for 15 in the batting order, and space for seven innings.
In a youth game, it’s more common to need the extra inning column for the case of a blowout batting around in an inning, but there are two factors that make it unlikely that a youth scorebook would ever need more than space for seven innings. First, most leagues employ some sort of mercy rule, ending the game early if one team gets too far ahead. A team that bats around almost by definition is scoring lots of runs, and is likely to trigger the mercy rule, ending the game in fewer than six innings. Second, an inning in which a team bats around is also one that takes a lot of time to play, and most youth games have some sort of time limit. In the rare instance a game goes beyond seven innings, the scoring could be continued on space for the next game in a book.
Not every team uses a continuous batting order; some bat nine and use substitutions as in “normal” baseball. This scoresheet can handle those, by having space for two players at each spot in the batting order.
Everything about a youth scorebook should be optimized to let the scorekeeper answer questions from coaches or the umpires about the progress of the game: the score, of course, but the inning, the number of outs, pitch counts, and sometimes the count on the batter. Better to use space to optimize the recording of such information than to take up space for summary statistics which wouldn’t be filled out until the game is over. This is in contrast to a professional game, where there is a scoreboard to remind everyone of the score and inning. For a professional game, the primary jobs of the scorer is to prepare the official score report that is submitted to the league, and most scorebooks are designed to let the scorer tally the statistics and “prove” the scorebook at the conclusion of a game. Youth games usually don’t generate such reports or statistics, and anyone who wishes to keep statistics will be doing so electronically.
The natural way to set up a scorebook is with the visitors, batting first, on the left-hand page. There are some circumstances—pool play rounds of a tournament, for example—when home and away aren’t decided until just before the game starts. Since you’ll want to get your book set up beforehand, there are boxes for home and away, and also labels for “top” and “bottom” of innings. The one that doesn’t apply should be crossed out. When someone asks what inning you’re in, you want to include “top” or “bottom,” and even though you can figure that out from home/away, it can be hard to do this on the fly. So the labels are there at the top of the inning columns.
Scoreboxes
As in all scorebooks, the individual scoreboxes in the main grid of the scoresheet are for recording the results of a plate appearance. The boxes in these scoresheets are designed to let the scorekeeper answer questions as efficiently as possible, and to give enough room to write as much detail as desired.
These scoresheets are a largely open design. They’re not completely blank, but you gain far more flexibility in what you record if one uses the basic abbreviations instead of trying to have something to circle or fill in for every possible outcome.
The series of five small sub-boxes are for recording pitches, explained below. The large sub-box is for the running pitch count total. This should start over with each new pitcher.
As with many scoring schemes, I like to keep track of runners’ progress schematically, around the baseball diamond. Some scorebooks (such as Bob Carpenter’s) leave the scorebox completely blank, and scorekeepers need to draw the base progress freehand. One can argue that the miniature baseball diamonds in each score box are unnecessary clutter, especially if the batter is put out without reaching base. Youth baseball typically features a much larger fraction of baserunners than does a professional game, and my handwriting—especially during an exciting moment in a game—is not good enough to freehand draw a baseball diamond while leaving room to record the method of advancement to the other bases. So these scoreboxes provide a hint for drawing a runner’s progress, small circles representing every base. They’re unobstrusive enough to avoid cluttering the box when a batter is put out. The diamond they make is large enough to record the running tally of the score, a more efficient use of space than filling the diamonds in.
The space around the schematic diamond is kept clear, to give enough space to record the method of advancement as a runner reaches each base. The circles themselves can be filled in to represent the positions of the baserunners when play stops.
Pitchers
Although many scorebooks are ambiguous about this, having the opposing pitcher’s statistics on a team’s scoresheet makes finalizing a pitcher’s statistics easier than flipping between the two teams’ sheets. You don’t get a team’s entire record on a single page, but this scoresheet is designed for in-game efficiency.
In some youth leagues, pitchers are given one balk warning before balks are called. This scoresheet includes a column for that, “BK warn.” When a balk warning is issued, I record the inning number and the jersey number of the batter, separated by a colon or slash.
The pitching section doesn’t include the entire pitching line that scorers need to for the official score report, but it does record the information you’d need—innings pitched and pitches thrown—to fill out a pitching affidavit in a tournament.
Keeping score
There are many guides to the conventional notation used in scoring, which is not nearly as standard as you might think. I’ve found the following notations helpful for in-game reference.
First, I fill in the dot for the base where every baserunner stops at the end of a play. So on a double, I draw the lines from home to first to second, but only fill in the dot at second. Same scheme for a single with an error allowing the runner to advance on the same play. It’s then a good check to glance at the runners on base and compare with where the endpoint dots are.
Without a scoreboard to turn to, everyone turns to the scorekeeper for the score. This sounds tautological, but without a scoreboard, it’s really hard to remember of the score. Traditional scorebook methods don’t lend themselves to instant readout of the score; the scorer might need to add all the runs from previous innings and tally the runs in the current inning. Using the scorebox diamonds to keep a running tally of the score avoids an uncomfortable pause to add the runs up.
Although it’s not necessary for compiling statistics (except RBIs), I record the player at bat for each advancement of a baserunner, prefixed with W, P, S, or D for wild pitch, passed ball, steal, or defensive indifference. The batter could be recorded in three ways: Ramzel and Tunnell recommend writing the batter’s defensive position number, but this doesn’t work with a continuous batting order and gets messy if kids switch positions frequently. One could also use position in the batting order, which in a traditional game is a single digit, but can be two digits with the continuous batting order. Better to write the jersey number, which you can get just by looking at the player without cross-referencing a lineup.
Pitch counts
Pitch counts are important for maintaining healthy arms of youth pitchers, and all leagues and tournaments set limits to the number of pitches any pitcher may throw. To prevent a pitcher from going over, we must track the pitches. This scoresheet tracks pitches in a way that also gives the count and makes it easy to recover from temporary lapses of attention. It’s an extension of the pitch tracking system devised by The Baseball Enthusiast blog, which is similar to the system used by Andres Wirkmaa.
In the upper left corner of each scorebox are five small boxes: the first column of three for balls and second column of two for strikes. To record a strike, use a slash for a swinging strike, a dot for a called strike, and an X for a foul ball. To record a ball, write the pitch number (of that plate appearance). For foul balls with two strikes, write the pitch number outside the balls-and-strikes box. Then the number of filled boxes immediately gives the count. Add one for the ball in play, and add this total number of pitches in the plate appearance to the previous pitch count, and the running pitch count is updated and can be quoted without delay.
This method does take room in the scorebox, but it’s more practical than dividing your attention to different zones of the scoresheet during a plate appearance. But the chief advantage over a sequential list of total pitches is the recovery from temporary lapses of attention. If you learn what the count is, you can fill in any pitch you might have missed, except for two-strike fouls. This will be more accurate, though, than simply trying to guess how many pitches you missed.
Assembling a scorebook
Using a PDF viewer with even minimal editing capability, you can create your own scorebook, and have it printed and bound at an office supply store or print shop. This can often be done while you wait. I’ve recently taken to printing my own scorebook on Rite-in-the-Rain paper, then having Fedex Office coil bind it with a clear front cover and dark plastic back cover. I’ll also spray-glue a sheet of chipboard to the back cover to give myself a decent writing surface.
My recommended layout:
- Front cover Team logo, season, league
- Inside front cover and page 1 roster with jersey numbers, schedule, any useful contact information. Pitch Smart USA pitch count guidelines. Field dimensions.
- Page 2-3 The scoresheets!
- continued facing pages Enough scoresheets for the season, plus a few extra
- after scoresheets League rules
- last page, opposite inside back cover Scoring abbreviations
For contact information, think of anyone you might need to get ahold of. Coaches, league officials, parks department. Do you know who to call if the field or equipment cabinet is locked? Consider also adding the street addresses of the fields you play on, both to remember where the fields are, and in the event emergency services need to be called.
It can be very useful to have the league rules printed in the scorebook, especially concerning legal bats, pitch limits and mercy rules. I’ve certainly been in situations where showing the rules to the umpire has made a difference in going forward with play.
Sample scorepage
(click to enlarge)
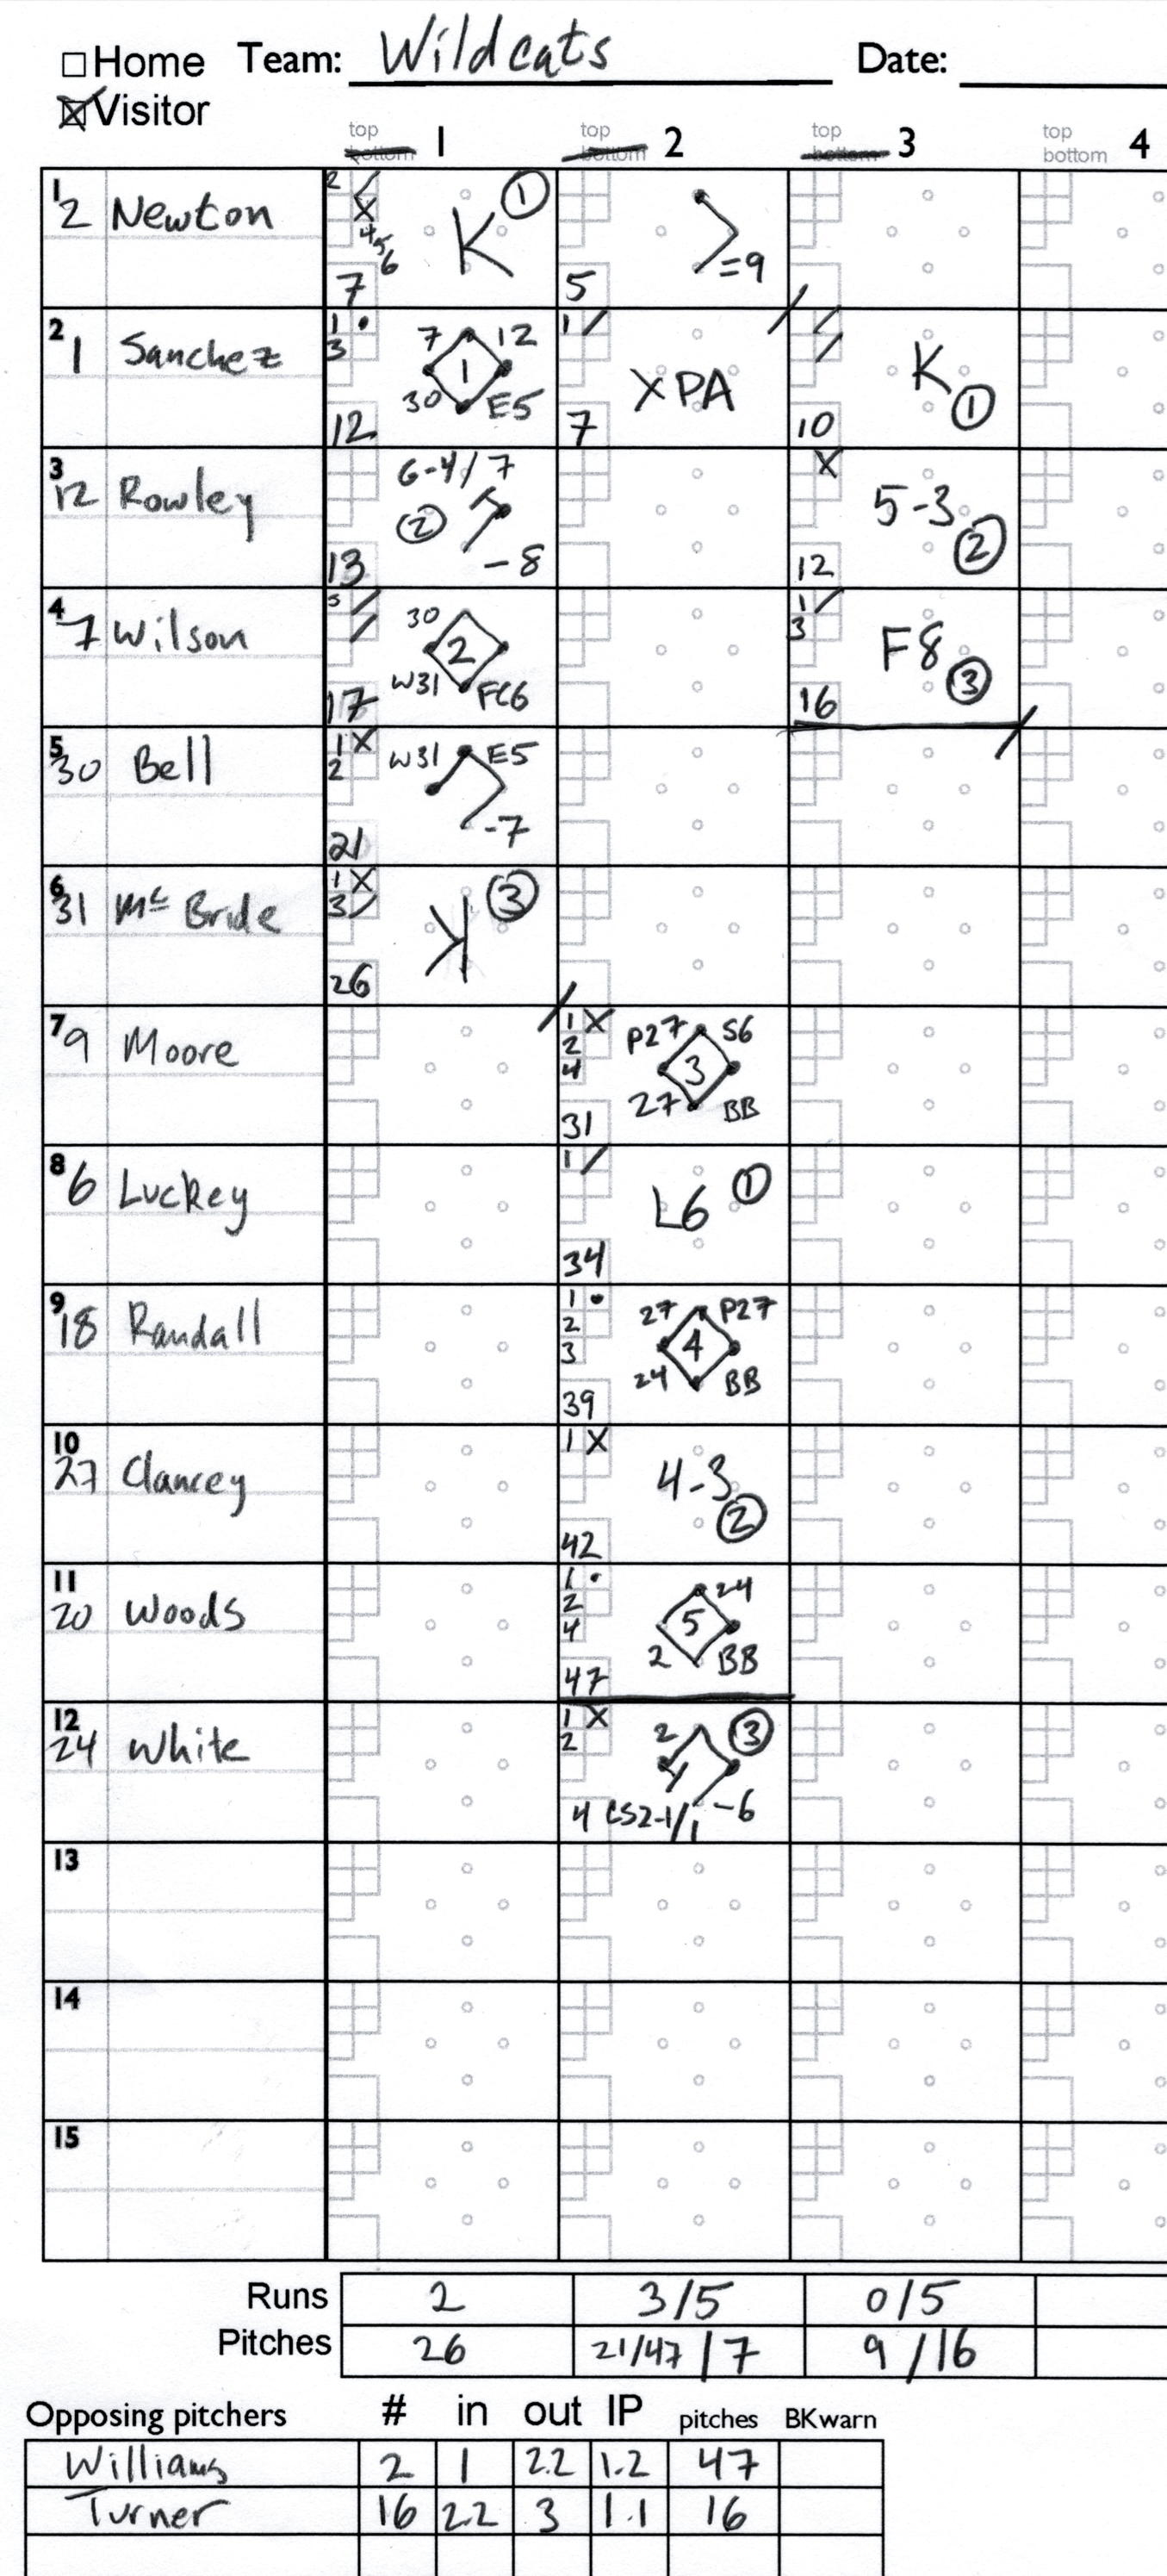
Narrative:
First inning
- Newton Williams pitching. Swinging strike, ball, four foul balls, swinging strike for out 1
- Sanchez Ball, called strike, ball, reaches on error by third baseman
- Rowley Singles to center. Sanchez advances to second.
- Wilson Two swinging strikes then a ball. Ball hit to shortshop, who throws to second baseman to put Rowley out for out number 2. Wilson safe at first on the fielder’s choice, Sanchez to third.
- Bell Two balls, foul, single to left but advances to second on an error by the third baseman. Sanchez scores.
- McBride Ball, foul. Wild pitch ball in which Wilson scores and Bell advances to third. A swinging strike, then a called strike three. Inning over, at 26 pitches.
Second inning
- Moore Ball, foul, three more balls to walk
- Luckey Ball, swinging strike. Moore steals 2nd. lines out to shortstop for the first out
- Randall Three balls, called strike, ball four walk
- Clancey Ball, gets away from catcher. Moore advances to third, and Randall to second, on passed ball. Foul. Groundball to second baseman, who throws to first for the second out. Moore scores, Randall to third.
- Woods Ball, called strike, three more balls to walk
- Turner pitching Williams lasted 1 ? innings and threw 47 pitches.
- White Ball, foul, Ball, single to short. Randall scores, Woods to second.
- Newton first pitch double to right field.
- Sanchez Ball. Then a swinging strike that gets away from the catcher. White tries to score, but is tagged out as by the pitcher on a throw from the catcher. Three outs. Sanches will be at the plate in the third.
Third inning
- Sanchez Three swinging strikes for first out.
- Rowley foul, grounder to third who throws to first for the out.
- Wilson Ball, swinging strike, ball, fly out to center field for the third out.
Note on ‘XPA’: Most scoring schemes don’t address the situation where the third out is a pickoff or caught stealing. If you’re not counting pitches, you’ll have nothing for the score box. But if you are counting pitches, you’ll have already marked the pitches thrown, and need keep the running pitch total going. So I write XPA, PA for Plate Appearance, and X to indicate it doesn’t count as a plate appearance.
Note on passed balls, wild pitches, and steals: Although the narrative inserts these into the sequence of pitches during the plate appearance, the notation doesn’t contain any record of which pitch they were associated with.
February 28, 2020 No Comments
APS March Meeting 2018 Epitome notes
Here are some of the things I came across while putting together my nicely formatted versions of the Epitome and Invited Speaker list for the 2018 APS March Meeting.
The first thing is, that as of 9am on Monday, February 26th, one week before the March Meeting, Session R16 is blank. Its supposed to be an invited session, but there are no speakers, no titles, and not even a “TBD.” Considering the session title, is this supposed to be a sort of backhanded statement?
The rest of these are inconsistencies mainly of interest to someone who’s trying to parse and reformat:
I mentioned in my earlier post using a regex to find chemical formulas, because the subscripts are no longer written out as LaTeX directives and are most often printed straight out. A number of things inadvertently match as chemical formulas (the middle initial “W”), but since the typesetting only changes when there are numbers, this isn’t really a problem. The “Tc” in “High-Tc” will match, and while leaving “Tc” as is would be fine, it’s easy enough to capture this and replace with High-Tc.
There are a few titles that were wholly put in quotation marks; these are unnecessary and can be stripped, but for titles that use quotation marks to set off a phrase, they were set with straight quotes, which should be transformed into open and close quotes for typesetting.
The March Meeting has 14 schedule blocks, 3 a day Monday–Thursday and 2 on Friday; these blocks are labeled with letters. Within each block are up to 59 parallel sessions. A session will have 15 contributed 12-minute talks, 5 invited 36-minute talks, or some combination of these. Some topics have enough contributed talks that there will be multi-part sessions, which are designated with roman numerals. The most popular such session this year is Devices from 2D Materials, which has eight parts. The topic First-principles Modeling of Excited State Phenomena in Materials has seven parts.
But somehow, the (lonely?) session “Coherence and Quantum Aspects of Living Systems I” does not seem to have a second part.
Subtitles are set off both with colons and with dashes. The dashes ought to be typeset as em dashes (—) with no space between the dash and text, but in the Epitome, there are at least three ways the dashes are printed: as single or double hyphens with space surrounding (” — “, ” – “), or a space and a hyphen (” -“). I convert all these dashes to em dashes for printing, but keep the colons.
I decided to tally these with my python scripts this year. There are three ways the Roman numerals are presented: at the end of a title, with no following text; preceding a subtitle, or in parenthesies. It’s fairly easy to make a regex that matches roman numerals, but it can capture too much, so I used positive lookahead to make sure it was one of these categories. But since X-ray also has a following dash, I had to make sure it was excluded!
But I wonder about the folks planning Advances in Computational Statistical Mechanics and their Applications. They’re labeled “Part 1,” “Part 2,” and “Part 3.” Do they have something against Roman Numerals? In all the years I’ve been going to the March Meeting, this is the first time I’ve noticed Arabic numerals to designate a multipart session.
February 26, 2018 No Comments
APS March Meeting 2018
I decided, back in January, that this was the year I’d transition my tcl scripts for re-formatting the APS March Meeting program into Python. I’m putting my python program here, but I don’t know if it will run on your system without tweaking. It needs two text files as input which I’ve traditionally cut-and-pasted from the APS March Meeting website: the Epitome, and the list of invited speakers (but see the discussion below).
I admit what I do here is sort of quaint, in this age of cloud-based apps and so forth: a script to take two text files and generate three LaTeX files which, when run, make 3 pdf files that you can print. But I do it in part because the APS Meetings app is still garbage: it’s a generic scheduling app that doesn’t take into account the particular structure of the APS March Meeting and isn’t optimized for its main task: helping attendees decide which of more than 60 places they ought to be at any one point. But a rant about the app can come later.
Here are the pdf outputs of my scripts. These use the Epitome and Invited Speaker lists as of a week ago, February 15th.
And if you like the idea of these but want to tweak the LaTeX formatting, here are the LaTeX sources for these:
Every year, there are changes to the format and structure of the meeting that force tweaks in the code, but this year was one of the most dramatic changes. The titles of invited talks used to use LaTeX commands to show mathematical symbols, Greek letters, sub- and super-scripts, and so forth. This year, there is only one invited talk that shows the $-delimited LaTeX commands in the invited talk list (L35.1), but if you view the abstract, the subscripts that these commands produce are rendered.
Many of the other talks with chemical formulas in their titles just write the titles out without subscripts, which looks ugly. So I found a regular expression that matched chemical formulas (and which needs the python regex package), and a LaTeX package that typeset them (mhchem), to make them look decent. But the regex isn’t good enough to capture something like “Fe1-x“. And then the regex also can’t tell that PHYS21 isn’t phosphorus-hydrogen-yttrium-henicosa-sulphate. So this required an unfortunate manual tweaking of the input file.
All of the Greek letters, and all the accent marks on speaker names, which used to be displayed with LaTeX commands, are now rendered. This good for readability, of course, but a disaster for a script that’s designed to take plain text and format everything with LaTeX. Parsing all the rendered formatting and unicode would add a whole extra level of programming difficulty.
I’m glad to have switched to python, though. My tcl script was merged together from what had been separate scripts to generate the different files, and I found a number of redundant arrays and unused variables, so the new program is much cleaner. Perhaps for next year, it will be able to scrape epitome and invited speaker list directly from the web. Or even better, perhaps APS will release a machine-readable scientific program. But then I might have to try to develop my own app.
February 23, 2018 1 Comment
A youth scorekeeper’s ethical dilemma
It’s the bottom of the 5th inning, my son’s 10U team at bat. They’re up 5-3. The first five batters get on base, and three score. With runners at first and second, a passed ball to the half-inning’s sixth batter advances the runners. With a 1-2 count, the batter strikes out, but it’s another passed ball, and another run scores while a runner advances to third. Nine to three. The seventh batter grounds out to third base, but the runner on third scores. A batter walks, another singles, and we have runners on the corners as the tenth batter is up. My son, incidentally, is on deck. The tenth batter strikes out. So the inning’s over, right?
I’m a scorekeeper, so I’m looking at a record of all of this. There’s another dad who’s scoring the game also, using GameChanger on his smart phone. We both understand the half-inning to be over.
Yet the umpire seems to think there are two outs. So do the coaches for my son’s team, and the coaches for the opposing team. So, apparently, do all the opposing players. The opposing team has no scorekeeper. My son says that he thought there were three outs, and started to walk to the dugout, when the umpire called out “batter up”. My son’s coaches later explain that they forgot about the sixth batter’s strikeout–possibly because a run scored on the third strike, which got by the catcher. The same thing probably happened to the opposing coaches.
Thinking the inning was over, I had started to get up from my chair to stretch, and the other scorekeeper dad and I tried to figure out what was going on. I might have looked a bit more agitated than usual, but ultimately we just said nothing. My son took his turn at bat, and grounded out, and the inning was really over. The other team didn’t score in the 6th, and our team won 10-3.
The question is: should we have spoken up? There’s a sort of easy argument why we should have, something about following the rules and making everything fair. Anyone can make that argument. So I’ll discuss the reasons why we should not have spoken up.
First, as parent-scorekeepers, we’re in sort of an ambiguous position. We’re not appointed by the league, and we’re not even a part of the team; we’re there as spectators and fans, but are also keeping fair and honest scorebooks. In a professional game, there is only one scorekeeper, who is appointed by (and paid by) the league (Rule 9.01(a)), and is an “official representative” of the league (Rule 9.01(c)). But not so in youth baseball. The rules for our league only mention a “home scorebook,” and thus implicitly a visitors scorebook, but does not mention a scorekeeper. Rules for Little League refer to a scorekeeper, but do not mandate one, and never say how a scorekeeper is appointed. Rules for the Babe Ruth League mandate each team keep a scorebook, but make no mention of a scorekeeper.
But in the Official Baseball Rules, by which MLB play, there is only one circumstance in which the scorekeeper is to alert the umpire of a mistake: Rule 9.01(b)(2) says: “If the teams change sides before three men are put out, the official scorer shall immediately inform the umpire-in-chief of the mistake.” This was not the mistake that happened in my son’s game. Although Andres Wirkmaa notes that having an inning end with less than three outs would “cause havoc statistically and otherwise,” and this is a similar situation, it’s not the same. Wirkmann states that OBR Rule 9, about scorekeeping, makes it clear that “the scorer… is a passive observer.”
This is particularly relevant in the case of appeal plays. The rules of baseball in other situations require vigilance. There are three situations that can be called on appeal: a runner who missed a base, a runner who didn’t tag up, or a batter who is out of order. In these situations, the umpire does know whether the offensive player tagged or missed the bag, but very explicitly does not alert the defensive team about the opportunity to put the runner out. The umpire will call the runner out if the appeal is made, but if the defense throws a pitch to the next batter, then they’ve lost their chance and the play stands.
The case of the wrong batting order is much more likely to be noticed by the scorekeeper than an umpire, and to this end, the Official Rules of baseball explicitly tell the scorekeeper: Rule 9.01(b)(4): “The official scorer shall not call the attention of any umpire or of any member of either team to the fact that a player is batting out of turn.” Here, Little League concurs: “The umpire and scorekeeper shall not direct the attention of any person to the presence in the batter’s box of an improper batter. This rule is designed to require constant vigilance by the players and managers of both teams.”
I would note the use of the word “the” in the Little League rule. That’s for the case where there is one scorekeeper, a representative of the league, whose job is to be neutral. That’s generally not the case in youth baseball and is not the case for our league either. Rather, each team needs to maintain its own scorebook, whether it’s kept by a coach, player, or parent. As parents, we’re there unapologetically of fans of our kids’ team, doing our bit to help.
So I will (and have) alerted our coach when our players are about to bat out-of-order, and would let them know if I saw the other team out-of-order. We only have two coaches; unlike a professional game, there is no bench coach who is keeping track of the opposing roster. In fact, despite rules which instruct coaches to give lineup cards to the umpires, most umpires don’t want the lineups, and the exchange of lineup cards is often handled entirely by parent-scorekeepers. All total, our role is more akin to that of a junior bench coach than that of a league official.
Certainly I would speak up if our team was on defense, put three out, but the umpire thought there were only two. And if the umpire, or opposing coach, or scorekeeper for the other side asked what I had for the number of outs, for the inning, for the score, or even for the count, I would say completely truthfully what I had logged in my scorebook, which I strive to make as accurate as is possible. And I would expect the same of an opposing scorekeeper. But here, nobody asked. It’s not my place to bring errors in our favor to anyone’s attention, except perhaps our own coaches, if I can alert them confidentially. This is a league that doesn’t compile statistics, much less appoint a scorekeeper to gather official statistics, and thus there’s much less to cause havoc with in the case of an extra out.
So what could have prevented this? The coaches are always reminding the players to talk to each other on defense. “Play’s at first and second, two out!” That sort of thing. Make sure everyone on the defense is aware of the situation. Constant vigilance. What was the defense not doing this weekend in the bottom of the 5th? Talking to one another. They weren’t calling out each out after it happened and they weren’t reminding each other of the the game’s situation. Now our team has a first-hand look at what can happen when you don’t talk. And if this episode can convince them that they do need to talk, then we certainly did the right thing by remaining passive observers.
September 19, 2017 No Comments
Tasks for youth baseball scorekeepers
There are three distinct tasks that baseball scorekeepers perform:
- Base charting
- Judgement of errors
- Compilation of statistics
Base charting is the act of recording plays as they happen, on the players/innings grid of the scorecard. It is, by far, the most important part of scorekeeping for youth baseball.
It is the scorekeeper’s responsibility to judge whether a particular play is counted as a Hit or an Error or a Fielder’s Choice, and in the case of a batter reaching a base beyond first, whether it is some combination of these. The scorekeeper determines whether a run is an Earned or Unearned run, which can include a reconstruction of the way an inning would have proceeded had an error not taken place. The scorekeeper also decides between a passed ball and a wild pitch, and whether a baserunner advances on a steal or defensive indifference.
In leagues where statistics are important, where statistics feed into salary negotiations, or where scouts for professional teams look over them, these judgements are tremendously important. In youth baseball, this is not the case. Assigning errors is of little use, and it is complicated by the often terrible field conditions on which youth games take place. It is really not fair to charge a fielder with an error when the ball takes a strange bounce on a stray rock on the field. And what should define “ordinary effort”–the benchmark by which errors are determined–when youth games have such a wide range of skill?
The compilation of statistics is to be done after the game is over–confusingly, not all instructions point this out. Most commercial scorecards have separate columns for recording player statistics, after the columns for innings. Typically, these include At-Bats, Hits, Runs, Runs Batted In, and Errors. These are a subset of the 18 separate statistics that the official scorer is required to provide to the league, as defined by Rule 9 of the Official Baseball Rules1
In a youth game, statistics may be useful to a coach, but they also may be a distraction. It may be useful to have a count of a player’s total plate appearances, if a coach wants to organize the batting order to give players as close to equal chances at bat as possible. The coach of my son’s travel team didn’t want any statistics, with the occasional exception of pitch counts. But in any case, the compilation of statistics is done after the game, and since the numbers will end up on a computer one way or another, one might as well start that way. That is to say, in a youth scoresheet, I’d rather devote extra space to clearer base charting than to the post-game compilation of statistics.
Back to base charting. In the best-case scenario, nobody needs to ask the scorekeeper anything throughout the entire game. But questions do arise, and by far, the most important thing a scorekeeper keeps track of in a youth game is the score. The coaches and umpire usually know the score, but it isn’t the umpire’s job to know the score. You need to know the score in a close game, of course, but also in a blowout, to determine whether a mercy rule applies. A scorekeeper should adopt a system that allows the immediate recall and announcement of the score at any time, without needing to tally up runs.
It is the umpire’s job to keep track of balls and strikes, and of outs and innings. Very rarely, an umpire has asked me as a scorekeeper to verify the count. More commonly, but still rarely, a scorekeeper will verify the number of outs, when, for example, a coach and the umpire disagree. When I’ve needed to do this, I give a brief narrative summary: “lead-off batter was number 53, who struck out. Number 6 walked, number 8 hit a double, number 9 grounded out to short, number 9 walked, number 13 struck out.” Umpires and coaches alike are often unsure of the inning, and will ask the scorekeeper where the game is.
For any aspect of the game, the clearer one’s scorebook is, the better evidence one can supply to bolster one’s version of the game, even in the face of rules that give preference to the home team scorebook. I’ve had a case where, as the visiting team scorekeeper I kept a full scorebook, while the home team just used tally marks to record runs; the umpire trusted my book. Fortunately, in the end, it was a decisive win for our team, so it didn’t matter much.
Finally, the scorekeeper is a check on the batting order. Despite rules that say to give an umpire a copy of the lineup, most youth umpires don’t want a copy and don’t check for inconsistencies.2 A travel team usually knows its batting order, even if it changes from game to game, but on rare occasion I’ve seen the wrong batter on-deck and alerted the coach.
June 15, 2017 No Comments
You should score youth baseball, even when you don’t need to
Back when I started this blog, I could have hardly imagined that baseball would be what brings me back to blogging after several years of blog dormancy. But my older son has become obsessed with baseball and has been playing since the second grade.
I’ve been keeping scorecards of his games, even back in the machine-pitch league where there is no record of scoring and no standings. It might seem against the recreational spirit to keep a scoresheet for a game where there isn’t supposed to be a winner or a loser. But even in such a game, there are many things to keep track of, and keeping a scoresheet using some version of the traditional scorekeeping methodology is the best way to do this.
Without an electronic scoreboard, it turns out to be easy to lose track of the inning, and even the number of outs. Youth baseball innings can last a long time; in the bottom of the 2nd you might wish it was the bottom of the 4th. In a machine pitch game, there are no balls or called strikes. There is usually a maximum number of pitches per plate appearance, but if your pitching machine keeps placing balls way out of the strike zone, you’re reluctant to charge the batter with pitches if the adult pitching machine operator is struggling to tweak and adjust the machine. Your memory can only hold so many events, and before you know it, you’ve forgotten how many are out.
Likewise, games can tediously drag on in the first season of kid pitch as well, when most pitchers are wildly inaccurate. You’ll have a sequence of several walks in a row, occasionally interrupted by a strikeout and maybe a hit-by-pitch. Youth baseball games have a two-hour time limit, and even so, I’ve been at games that barely get into a third inning. And most everyone–players, coaches, parents–would expect that more of a game could have been played in that timeframe. And so without a scoreboard to glance at, one loses track.
So at the youngest levels, it’s not so much scorekeeping, but outs-and-innings-keeping. One could do this with the sort of click-wheel counter that umpires use. I’ve used these, but it’s not that difficult to get an extra errant click. Or to forget whether you’ve clicked, especially on a drawn-out play.
In addition to outs and innings, a scorecard also tells you who is up next to bat, and if your team uses a different batting order each game (which it probably should), then the players will likely not always be aware of their turn to bat. There is a lot of sitting around in baseball, and young players will often find ways to amuse themselves which don’t involve paying attention to the game. So somebody needs a definitive record of who is up next to bat.
Many leagues have rules to keep a game from becoming too lopsided: a team might be restricted to hitting once through the batting order in an inning, or there may by a maximum number of batters. There’s also a common rule that limits a team to scoring 5 runs in any inning that’s not the last inning. In all of these situations, you’ll need some sort record of what’s happened, and they’re automatic if you’re keeping a scorecard.
Perhaps one could come up with an alternative method of tracking outs, innings, runs, and batters, but it’s hard to imagine a system that would be simpler than the traditional baseball scorecard. At its essence, a baseball scorecard is a grid with columns for each inning and rows for each batter. Defensive players are numbered 1-9, and a strikeout is a K. The result of a batter’s plate appearance in a particular inning is recorded in the appropriate box on the grid. There are many common conventions but little else is standard. As a player grows older and the game becomes more competitive, you might need to track more things; the scorecard can become as complex as need be. And an advantage of using a traditional scorecard from the start is that it gives you practice for the more sophisticated scorecards that will come later.
So, keep a scorecard, even if you aren’t keeping score.
May 25, 2017 No Comments
March Meeting 2017
Back when I regularly updated this blog, I’d post about the APS March Meeting. I’ve been going to the March Meeting since 2003, only having skipped 2014. Every year since 2006, I’ve scraped parts of the program with some evolving Tcl scripts in order to re-format them in ways that make sense to me and let me sort through the immense schedule and figure out which talks I want to see. This year I could 734 sessions and 1030 Invited speakers. I estimate there are 8300 contributed talks and 1175 posters.
It’s too much to read through all the titles (let alone abstracts) of all the contributed talks, so the first step is to nicely format the session titles. I put them on one page, use typography to distinguish Focus Sessions and Invited Sessions, and indicate the total number of invited talks.
It is feasible to skim through all the invited talks, if presented correctly. I group them by time block and session, and include the author name and talk title. This way, I can look for topics that look interesting and speakers I know to be good. And I do look through the whole thing. The APS does have a list of invited speakers, but it’s listed alphabetically by author, which might inadvertently lead one to pick conflicting talks to attend, and also makes it hard to search for interesting topics.
Finally, I make a session/block grid, to show the overall structure of the meeting.
Here’s what I have for the 2017 March Meeting:
March 12, 2017 No Comments
Backing up the blogs
Although this blog has been mostly dormant for quite some time now, my two other blogs–the Matthew Picture of the Day and the Peter Picture of the Day–have been plugging along, barely missing a beat. I do have all the photos on my home computer, of course, which I back up twice (continuously via Time Machine and also to CD-ROM). But I’ve been a bit cavalier about backing up the blog. I’ve periodically done manual backups before major upgrades, but I’ve sort of naively trusted in Bluehost not to lose my content. A year ago or so, Bluehost had a substantial hiccup and MPOD was offline for several hours. They did rebuild everything, and all was well, but the episode did give me pause. Also, I remember Photopoint.
So it was time to get serious about backing up the blogs. These were my criteria:
- The backup must be stored by a different hosting company than that which hosts the blog. After all, I want to be able to recover if Bluehost has a catastrophic failure.
- The entire site must be backed up. As of now, the MPOD is at about 800MB and the PPOD is about 500MB (until the debut of the PPOD, I uploaded only the small size photos to the MPOD, but now I upload the full-sized originals to both, which is why the MPOD archive is not much larger). This is particularly important because PhotoQ, the photoblog plugin that I use, stores the photos in two directories of its own creation within wp-content. So the backup solution must be able to see and archive these.
- The backup must be automatic. I don’t want to be required to start each backup and I especially don’t want to have to use my home computer as an intermediary in transferring the archived files.
With this, I evaluated four automatic backup plugins. Rather, I installed and tried three, all of which failed in one way or another, before I found one that worked. My present solution is XCloner, stored on Amazon S3. Here are my experiences with the four plugins:
The first one I used was Automatic WordPress Backup. I do have to give this one credit: it was the first one I heard about that used Amazon’s S3 service to store the data. So it’s a pioneer of sorts. It has its own website and a slick demo video. Like many folks, though, I’d start a manual backup, it would finish, but nothing would have happened and there would be nothing stored on S3. Eventually I found the log file and discovered that it was running out of memory. This problem I could actually fix: I had inadvertently left about 10000 spam comments in the WordPress database, and clearing those out allowed the plugin to finish. But seriously, 10000 comments is not really all that many for a high volume blog. So the first problem with this was that it didn’t look like it could scale. (Note further that the flashy promotional videos and postings on the blog were not done by the programmer, and that the programmer is working on a different plugin now with similar functionality.)
The second problem was that AWB backed up the database and a few set directories, but not arbitrary directories introduced by other plugins. So only the database structure of the photoblog was backed up, not the photos.
And it also seemed that, despite all the flashiness of the website, it was quickly becoming abandon-ware. There hasn’t been a new version since August 2010. I had posted a question on their product blog asking if there was a way to backup other directories, but it was forever stuck in moderation and has never been posted. I think they had expected more people to buy premium support (which is no longer for sale). They were also upset that WordPress’s rules prohibited them from automatically inserting a link to them in the footer of each of your blog pages. And they also insisted that, instead of being controlled through the ‘plugins’ or ‘settings’ menus in WordPress, they needed to add their own menu to the main sidebar. And, I think it’s lost compatibility somewhere around WordPress 3.2.
The next plugin I tried was wp Time Machine. It has a very simple interface and does back up all files. It’s designed so that you just type in the minimal information needed and then click “generate archive,” so it’s a little counter-intuitive that you need to first click ‘Show Plugin Options’ to switch from the default Dropbox to Amazon S3. The instructions are found within the plugin interface, but it sends you to a blog post to get the details of setting up the cron job needed to run the backups automatically. It also automatically includes, in the files it saves on Amazon S3, an instructions file for recovering after a crash.
I initially had file compression turned on while making the archives, and when adding the photo files to the archive, it would ungloriously quit running after about 330MB, leaving an incomplete and corrupt archive file. Turning off compression I was able to get the PPOD site successfully backed up–I saw the full file archives appear in the Amazon S3 console–but the plugin page display just indicated that the backup was in progress. (Turns out, JPEG files are already pretty well compressed and ZIP won’t make them much smaller.) In fact, several times I left it for hours thinking it was still working on the backup, because that’s what the screen indicated, while in fact it had hung up somewhere. Trying both PPOD and MPOD, I variously got failures to finish building the archive file, a finished archive file that failed to transfer to Amazon S3, and successful transfers to S3 that failed to indicate completion in the plugin dashboard. Perhaps it runs better via cron job, but it seemed like this plugin had troubles with lots of files.
The third plugin was pressBackup. They sell their own cloud storage service, but their plugin is free to use with Amazon S3. It uses a wizard to walk you through the setup process in a completely intuitive manner. It just asks you what service you’re using, how often you want to backup, and how many previous copies you want to keep stored. But the problem: they allow you to backup the database, themes, plugins, and uploads. Not arbitrary files and directories. So, like Automatic WordPress Backup, it wouldn’t save the photos. That, and its easy configuration was perhaps too easy: although you can have a daily backup, there’s no way to set the time at which the backup will execute; it will always execute at the same time as your first backup. I sort of imagine that servers are more idle and bandwith is more plentiful in the middle of the night, which is when I would want to schedule backups. But you don’t need to configure your own cron jobs.
Which brings me to XCloner, which I’m currently using. It is tremendously flexible and the configuration is both more involved and less obvious than with other products. It has a PDF manual, which seems to be a few releases behind. It did take a bit of work for me to get it up and running, but once I figured it out, configuring it for subsequent blogs was completely straightforward. But it was far from obvious which configuration options needed to be set and which didn’t need to be.
A few notes: you need to create your own directory structure, preferably in the blog’s top level directory, for it to store the backup files (which will then get transfered elsewhere). In order to transfer to Amazon S3, it needs to be run from a cron job; a manual backup will only create and store the backup file. There are quite a few settings that one doesn’t need to bother with (for example, cron configuration names). And the plugin itself has a username and password, that it wants you to configure right away–I suppose this is useful for a multi-author blog. If you want to do things like doing a nightly backup of the database only to be stored locally and a weekly backup of the whole site transferred to an FTP site, then XCloner can do that. It didn’t have any trouble with the large number of files I needed to back up, but if it did, then it has an option for an incremental backup that works on a smaller number of files at a time.
So in the end, there are no circumstances in which I’d recommend Automatic WordPress Backup. If you don’t want to mess with cron jobs, and the limitations to pressBackup don’t deter you, I’d recommend it first. If you need more flexibility–say with when the backup executes–and if the size of your site doesn’t trip up wp Time Machine, I’d recommend that. And if you have having things configured for you and want lots of settings available for tweaking–or if the other options won’t work for you, then XCloner will certainly get the job done, once you figure it out.
November 13, 2011 No Comments
Diagnostic post
This is a second diagnostic post, to see how the WordBooker plugin settings work. This is supposed to show up as a status update in my facebook.
November 11, 2011 No Comments
Blogging again?
Yes, this blog has been idle for many months now, but that doesn’t mean I don’t have dozens of potential blog posts mulling around in my head. This is my second diagnostic post, to see if the WordBooker plugin works, which is supposed to be a way to post my new blog posts to my Facebook wall. (The first diagnostic didn’t post to Facebook, do it’s been deleted. Sorry if that interfered with your RSS reader.)
November 11, 2011 No Comments