
VMT and MPG
Perhaps the best reason to listen to Sierra Club Radio is to hear the fascinating guests that come on the show, who often manage to say something insightful despite host Orli Cotel’s bubbly demeanor and loaded questions. But one theme has come up in two recent programs–indeed, you hear it often from the Sierra Club–that really gets to me: the notion that the answer to the problem of our nation’s oil consumption is to “go farther on a gallon of gas” by raising fuel economy standards. Since raising fuel economy standards is just about the only progressive thing left in the energy bill that made it through Congress, much has been made of this phrase of late.
It seems simple enough: increase the fuel economy, and our fuel use goes down. But there’s a really big if here: that’s if the number of miles driven doesn’t go up. I will argue in this post that there’s no evidence to support the notion that the amount of driving will stay fixed. This is the problem with the phrase: “going farther” implies more driving, by using the same amount, “a gallon,” of gas.
From the standpoint of an individual, many environmentally-minded folks buy high fuel economy cars in order to achieve “guilt-free” driving. When faced with a transportation decision: whether to travel, and if so, which mode to choose, the fact that one has a car with higher than average fuel economy certainly makes it easier to choose to drive. This is actually a well-known phenomenon known as the Jevons paradox: improvements in efficiency of consumption of some good leads to a larger overall rate of consumption of that good, because use of that good becomes feasible for more uses as the efficiency grows. It’s the same reason you spend more time online when you have a faster Internet connection. Overall, America’s gasoline consumption is analogous to a (faltering) dieter who eats a whole box of fat-free cookies because they’re “healthy.”
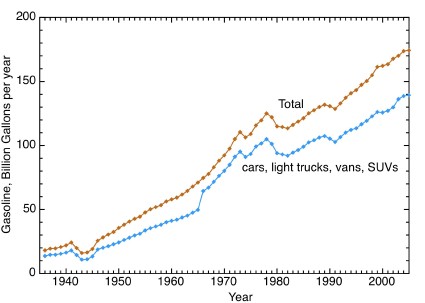
Environmentally-minded people can agree that rising gasoline consumption is a problem. The figure below shows gasoline consumption per year, overall, and for cars, light trucks, vans, and SUVs.1 I don’t know that there’s a consensus on what sort of annual gasoline consumption can be considered sustainable, but I’m certain that it must be lower than the consumption of recent years.
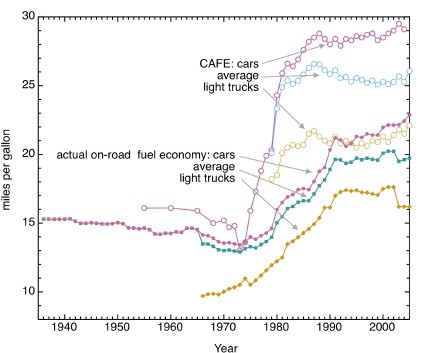
So how efficiently has this gasoline been consumed? The next figure shows fuel economy in six ways.2 Three curves are actual on-road data: the FHWA estimates total miles driven, and measures total gasoline consumed. Cars and light trucks are shown separately:3 car mileage has continued to increase since the 1970s, but in recent years the growing popularity of light trucks, vans, and SUVs, whose mileage has been at a plateau since the late 1980s, has caused the overall mileage average for 4-wheel vehicles to remain roughly constant since the early 1990s. Shown with open symbols are corresponding Corporate Average Fuel Economy (
CAFE) figures: these are averages of measured fuel economy for new cars sold in each year, weighted by the number of each model sold. The actual fuel economy of cars on the road is much lower than this figure both because older less fuel-efficient cars stay on the road for several years, and because the CAFE estimates of fuel efficiency are optimistically high.
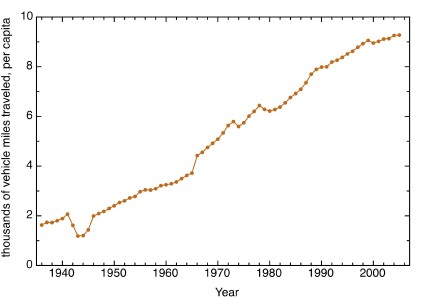
So, if fuel economy is flat, but gasoline consumption is rising, is this just the result of more cars on the road being driven by a growing population? Well, no. The figure below shows the per-capita vehicle miles traveled (VMT). This is the total annual miles driven of all the cars and light trucks on the road, divided by the population. It has been steadily climbing, hardly taking a hit even during oil shocks.
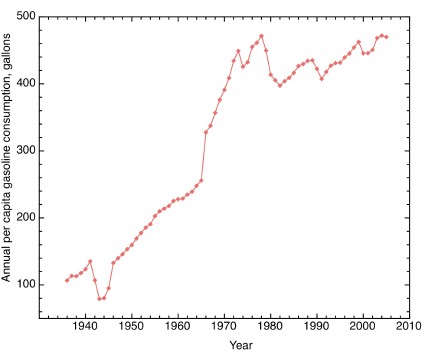
When we look at per capita fuel consumption, in the figure below, we see that the dramatic improvements in fuel economy that began in the mid-1970s have been more than completely nullified by increases in miles driven. For a few years, between 1979 and 1982, consumption dropped a little, but since then a steady increase in consumption began again. The graph shows some jumpiness because population figures jump during census years, but the trend since 1980 is that on average, each of us has been steadily consuming more gas. Our gasoline consumption these days is the same as it was when the average vehicle on the road got 13.7 miles per gallon.
Putting some of these figures together, is there any evidence that gasoline consumption will go down if the fuel efficiency of new vehicles increases? No. Each year is represented as a point in the figure below, with per-capita gasoline consumption plotted versus the CAFE of cars sold that year.
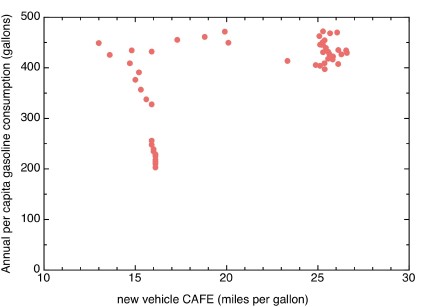
Arguments that focus on raising the fuel economy of new cars are essentially arguing that the key to reducing oil consumption is to move to the right on the above graph, in hopes that they will also appear lower. It should be clear that there is no trend in the existing data to suggest that this is likely.
Of course, in the struggle to deal with global warming and foreign oil dependence, the variable that matters is total oil consumption, not per-capita gasoline consumption. One can do a plot similar to the one above, putting total gasoline consumption on the y-axis instead of per-capita consumption; the graph looks essentially the same.
All this is part of the reason we need to put more emphasis on the vehicle miles traveled part of the equation and stop the obsession with fuel economy. I will write more about such steps in future posts, but the key is to create communities and places where people can do most of their daily business without needing to get in a car.
10 comments
Great post Tom — right on target. Unfortunately, communities that allow people to live without a car are few and far between in this country. Living in my urban bubble, I’m always astounded by the depth and scale of our nation’s automobile dependency whenever I venture to the beyond the Beltway or out to the “provinces.”
Also — I think I successfully taped your show on the History Channel last night.
Or one could tax the hell out of gasoline consumption and thereby stimulate the creation of these dense communities.
A substantial gas tax would help. Another legislative bit that’s needed is to reform zoning laws that make it impossible in many jurisdictions to make compact urban communities. Washington DC, as American cities go, is pretty walkable and urban. The densest and most urban parts of the city–which are also the most cherished parts–were given their basic forms when either walking or streetcars were the dominant mode of transportation. Shamefully, the building patterns in most of these cities would be illegal to build again under the current zoning laws, mostly because very little space is wasted on off-street parking.
[…] per capita since the early 1930s (Source: Federal High Way Administration FHWA, thanks to Metacaffeination) and comparing them with historical series of average real hourly wages from 1947 (Source: Bureau […]
[…] per capita since the early 1930s (Source: Federal High Way Administration FHWA, thanks to Metacaffeination) and comparing them with historical series of average real hourly wages from 1947 (Source: Bureau […]
[…] per capita since the early 1930s (Source: Federal High Way Administration FHWA, thanks to Metacaffeination) and comparing them with historical series of average real hourly wages from 1947 (Source: Bureau […]
[…] per capita since the early 1930s (Source: Federal High Way Administration FHWA, thanks to Metacaffeination) and comparing them with historical series of average real hourly wages from 1947 (Source: Bureau […]
[…] does not necessarily reduce gasoline consumption, and hence, gasoline expense. In fact, gasoline consumption has steadily increased over the years even as vehicles have become more fuel ef…. The reason is behavior. Higher fuel efficiency lowers the cost per mile to drive, which […]
[…] While some of this VMT increase comes from more cars on the road the majority of the growth is in per capita mileage. For a nice analysis and an introduction to Jevons paradox check this post from metcaffeination. […]
[…] per capita since the early 1930s (Source: Federal High Way Administration FHWA, thanks to Metacaffeination) and comparing them with historical series of average real hourly wages from 1947 (Source: Bureau […]
Leave a Comment