
Bailout and Mathematica
A friend of mine (and regular commenter here) has pointed out that, even if the $700,000,000,000 bailout passes, and adds to our National Debt, we’d still have a Debt-to-GDP ratio that was less than Germany’s.1 Wikipedia says that the US National Debt is 60.8% of our GDP, that Germany’s is 63.1%, and that our GDP is $13.8 trillion. Well, add $700 billion to 60.8% of $13.8 trillion and the new figure is 65.8%–pretty close; there are different ways of measuring both GDP and the Debt.
But I realized that this sort of comparison is something that Mathematica 6 is supposed to be good at. Mathematica is an amazingly powerful system for doing mathematics on a computer. Its strength, traditionally, has been symbolic manipulation–I most often use it for the Integrate command, which can do most of the integrals that in grad school I’d look up in Gradshteyn and Ryzhik. Version 6 has added, amongst other things, a huge library of curated data, loaded over the Internet, that’s relatively straightforward to use.
The command CountryData gives access to all sorts of country-by-country information, including “GDP” and “GovernmentDebt”. So following one of the examples in the documentation, I produced this graph, plotting the Debt-to-GDP ratio versus GDP for (nearly) all the countries for which Mathematica has data. (Note that the x-axis is a logarithmic scale.) The United States, before and after a $700 billion bailout, are shown in green and red, respectively.
If the xhtml export actually works the way it’s supposed to, you should be able to hover your mouse cursor over each point and have a little ToolTip pop up telling you which country the data are for.
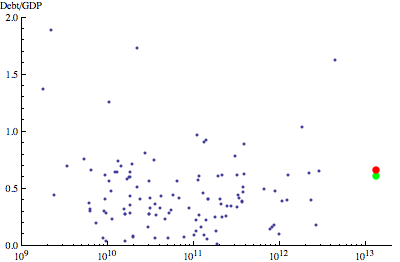
|
| GDP [$US] |
Mathematica has a syntax that strikes many as arcane. Since I learned about computers with procedural programming, and haven’t really done any functional programming, I too struggle to get Mathematica to do what I want it to do. But one can often do complicated things, such as the above graph, with a very compact command. To make the main graph–the red and green dots are relatively trivial additions–the command I used is:
gdpplot =

 ListLogLinearPlot[

  Tooltip[{CountryData[#, "GDP"],

      CountryData[#, "GovernmentDebt"]/CountryData[#, "GDP"]},

     CountryData[#, "Name"]] & /@ CountryData["Countries"],

  PlotRange -> {{10^9, 2 10^13}, {0, 2}}]
There are a couple things one needs to understand for this to make sense: First is Mathematica’s syntax for pure functions, using all the stuff with the #s and up through the &. Second, the /@ is shorthand for the Map command, which means apply the function on the left to each element of the list on the right. Finally, the command CountryData["Countries"] produces a list of all the countries for which Mathematica has data.
- He is, nevertheless, against the bailout. [↩]
1 comment
[…] occurred to me that this is an easy thing to investigate with Mathematica, much like my earlier post on the Bailout. Mathematica 6 includes access to a huge library of curated data, including historical values of […]
Leave a Comment